
How the maps of ancient Earth are made
Outcrop shows a globe of the Earth as it was when a rock formed, as far back as 1.8 billion years ago, in the app and on the web. This page explains where those maps come from, which parts are based on evidence and which are filled in, and how we checked them.
Two sets of maps
For the last 540 million years, the maps are Christopher Scotese’s, from his PALEOMAP PaleoAtlas. He drew them from the rock record: his coastlines and seaways follow where marine rocks of each age are found today. A rock’s position on them is calculated with his PALEOMAP plate model, the same model the maps are drawn on.
His atlas has only a few maps older than 540 million years, far apart in time. For 550 million to 1.8 billion years ago, we drew our own, one every 10 million years, in his style. They are drawn on the plate model of Cao et al. (2024), which reconstructs the continents, plate boundaries and plate motions back to 1.8 billion years ago.
The two plate models don’t agree on where the continents were. When a rock is older than 540 million years, its position switches from Scotese’s model to Cao’s, and it can move thousands of kilometers. Paleomagnetism records a continent’s latitude but not its longitude, so we rotated Cao’s model 72° east around Earth’s axis, which brings its continents closest to Scotese’s 540 million years ago without changing any latitude. The difference that remains, a median of about 22° of latitude, reflects real disagreement about where the continents were in the Ediacaran.
In Scotese’s style
The look of our maps is Scotese’s. The colors for each height of land and depth of sea are taken from his maps, the land’s from his map for 540 million years ago, before plants covered it. As on his maps, the relief is shaded as if lit from the northwest, plate boundaries show as ridges, trenches and mountains rather than lines, islands are drawn larger than life so they can be seen, and today’s coastlines are drawn over the top. Where the evidence is thin, he fills in detail to make a readable map, and so do we. Our maps are meant to carry his atlas further back in time. Their mistakes are ours, not his.
What our maps are built from
| Source | What it provides |
|---|---|
| The plate model | Continents, plate boundaries, and, through GPlately, the age of the ocean floor |
| Calculated from the model | Ocean depth, sea level, trenches, mountain ranges and island arcs |
| The rock record | Seas and land where dated rocks of that age have been found |
| Filled in | Hills, basins, the width of continental shelves, the texture of mountains, and where each island lies |
The ocean floor
New ocean crust forms at mid-ocean ridges and sinks as it cools and ages. The age of the ocean floor comes from the seafloor-age tool in GPlately, run on Cao’s model: it makes new crust at the model’s ridges and carries it on the plates until a trench takes it. We converted age to depth with Stein and Stein’s (1992) GDH1 curve, which describes today’s oceans. The model begins 1.8 billion years ago with no older ocean floor, so GPlately estimates the ages of the first oceans from their distance to the nearest ridge. The ocean floors on the oldest maps are less certain than those on younger ones. The ridges are drawn about 1,200 meters shallower than the curve gives, so they stand out from the deep ocean as they do on Scotese’s maps.
Plate boundaries aren’t drawn as lines. As on Scotese’s maps, they show in the shape of the ocean floor and the land: shallow ridges, deep trenches and mountain ranges.
Trenches
Trenches are drawn where the model has subduction zones, on the side of the plate that sinks. Today, older ocean crust, which is colder and denser, sinks into deeper and wider trenches, and the trenches on our maps follow the same pattern. The way each trench widens and narrows along its length is filled in.
Mountain ranges
Mountains are drawn along subduction zones on the overriding plate, like the Andes today. Where two continents collide, the mountains are higher and wider. When subduction stops, the mountains stay on their plate and wear down: a collision belt over about 300 million years, and a volcanic arc over about 150 million years. These rates are rough estimates. The model begins 1.8 billion years ago, so mountains raised before then aren’t shown.
Island arcs
Where ocean crust sinks under other ocean crust, as at the Aleutian and Mariana Islands today, a chain of volcanic islands is drawn on a submarine ridge about 160 km from the trench. The model shows where subduction happened, but not where each island was, so the islands’ positions are illustrative. Like Scotese’s, they are drawn larger than real islands so that they can be seen on a globe.
The plate model has more of these ocean-to-ocean trenches than Earth has today: about 70% of its trench length, compared with about 40% today (Stern, 2002). So islands are drawn along about 60% of each arc, and only the submarine ridge along the rest.
Sea level
Over hundreds of millions of years, sea level rises and falls as the ocean basins change. Young ocean floor is shallow and old ocean floor is deep. While a supercontinent holds together, the ocean around it grows older and deeper, and sea level falls. When the supercontinent breaks up, new ridges make a lot of young, shallow ocean floor, which pushes water onto the continents (Worsley, Nance and Moody, 1984).
We calculated the average depth of the ocean floor for each map and used its change to set sea level. Sea level is measured from its level 550 million years ago, so our maps meet Scotese’s without a jump. At that time the sea covers about 35% of the continents, compared with about 45% on Scotese’s map for 540 million years ago. Studies of the last few hundred million years have found that this method overstates the changes (Wright et al., 2020; Young et al., 2022), so we use half the calculated change. Sea level is lowest about 940 million years ago, when Rodinia had been assembled, about 150 meters below its level at 550 million years ago. Before 1 billion years ago we stop following the calculation, for the reasons given under “How we checked the maps”: sea level settles by 1,040 million years ago and holds there, about 116 meters below its level at 550 million years ago.
Ice ages
During the Sturtian (717 to 660 million years ago) and Marinoan (645 to 635 million years ago) glaciations, the land is covered in ice and the sea is frozen from the poles to 40° latitude, thinning to open water at 25°. Scientists still debate how close to the equator the ice reached, so the extent shown is one possibility.
The rock record
The plate model doesn’t say where shallow seas covered the continents. For that, we use three open databases of dated rocks:
- Macrostrat’s stratigraphic columns, mostly in North America
- Collections in the Paleobiology Database, worldwide but almost all younger than 540 million years
- Marine sediment samples in DM-SED (Lai et al., 2025), worldwide and back into the Proterozoic
We use only rocks whose age is known to within 100 million years. Each one is moved back in time on its plate. Marine rocks show that the sea covered that spot at that age, and rocks that formed on land show land. Near these sites, the map shows sea or land as the rocks record. A column with no rock of a given age isn’t counted as land, because rock may have formed there and later eroded away.
What’s filled in
Where there’s no record, the height of the lowlands depends on the plate’s setting: the edges of newly rifted continents sink and flood, and the interiors of large continents stand higher. Hills, basins, the width of the continental shelves and the texture of mountains are generated from random patterns, the way Scotese fills in where the record is thin. The patterns are fixed to the ground, so they move with the plates from one map to the next. These patterns shape the land but don’t create seas. Inland seas on our maps come from the rock record, and the seas along the continents’ edges come from sea level.
Today’s coastlines and borders, from Natural Earth, are drawn on all our maps for reference, moved back in time on their plates.
How we checked the maps
Against Scotese’s maps
To test how we use the rock record, we drew a map for an age Scotese also mapped. At 90 million years ago, our method finds the Western Interior Seaway across North America from the rock record alone. Where the record is thin, as across much of Asia, our map shows fewer seas than his. Our mountains are inferred from the plate model, so they are narrower than his where a range was broad: west of the seaway he draws the Sevier highlands, and we draw a coastal range.
We also placed the record on PALEOMAP’s plates, the ones Scotese’s maps are drawn on, and compared it with his maps directly. In most ages we checked, 85% to 96% of marine sites lie in his seas or within 150 km of them. In the Triassic and Jurassic, about half do. Seas then were narrower, so marine sites lie near his coasts, where a small difference in time or place puts a site on either side.
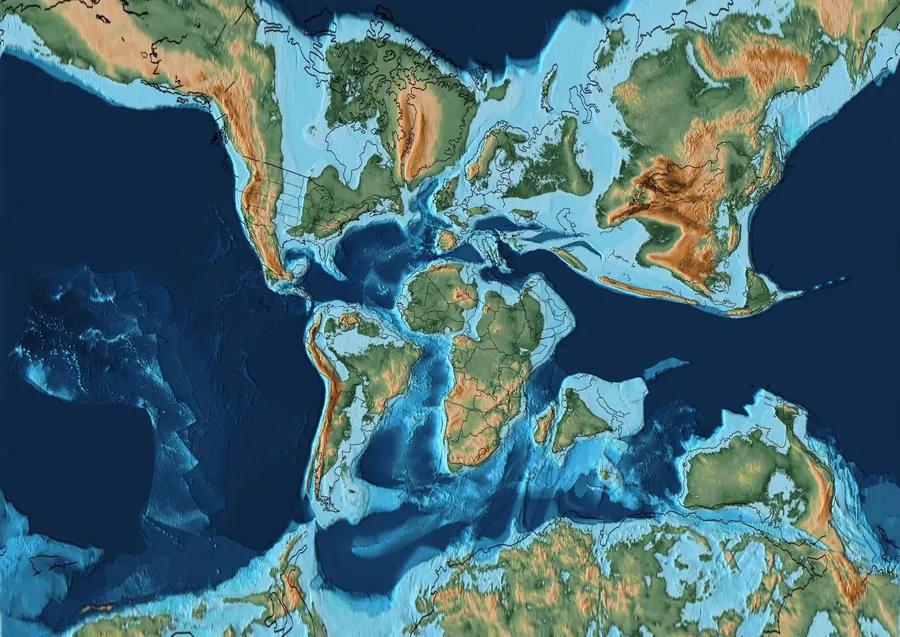 Scotese’s map
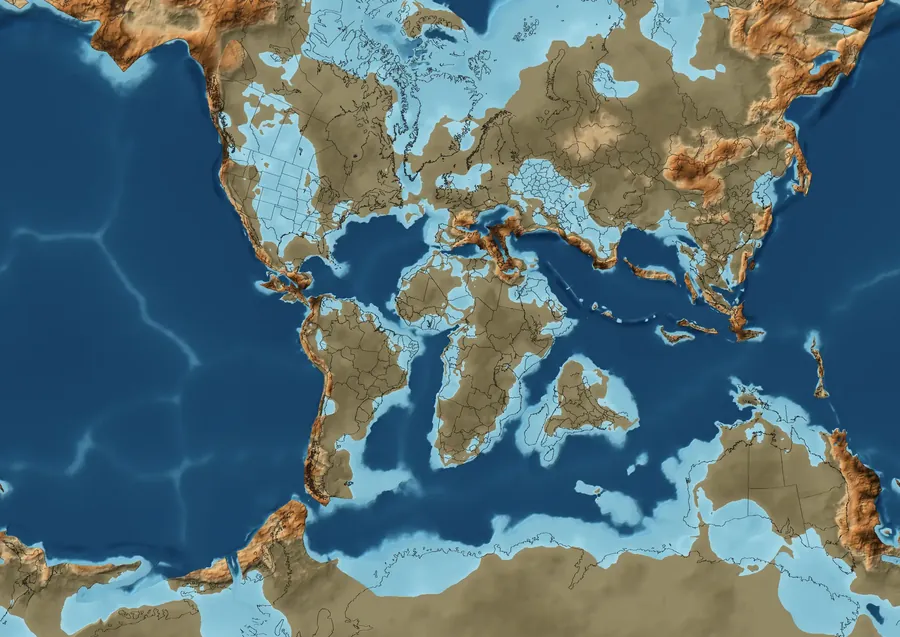 Our method, as a test
Ocean floor ages
Müller et al. (2025) also calculated the age of the ocean floor in Cao’s model, for every million years, for a study of the carbon cycle. The average ages from our GPlately run follow theirs closely. Both come from the same plate model, so this shows that our run agrees with theirs, not that the ages are right. It matters because sea level is calculated from these ages.
Sea level against the rock record
The rock record we use is almost all marine, with very few dated land deposits, so it can’t show where the shoreline was. It can show whether more marine rock survives from times when the calculated sea level is high. For each map, we measured the area of the continents where the record shows sea. Older rock is rarer, so we fitted one trend to how that area falls with age, about 1.3 times less for every 100 million years older, and compared each period with it: 2× means twice the marine rock the trend predicts, and 0.5× half.
| Million years ago | Calculated sea level | Marine rock against the trend |
|---|---|---|
| 550–640 | −34 m | 15× |
| 650–740 | −76 m | 1.7× |
| 750–840 | −81 m | 0.5× |
| 850–940 | −135 m | 0.3× |
| 950–1040 | −117 m | 0.2× |
| 1050–1140 | −59 m | 0.2× |
| 1150–1240 | −49 m | 0.05× |
| 1250–1340 | −100 m | 3.2× |
| 1350–1440 | −124 m | 9.3× |
| 1450–1540 | −135 m | 1.1× |
| 1550–1640 | −128 m | 0.6× |
| 1650–1740 | −114 m | 4.3× |
| 1750–1800 | −114 m | 0.7× |
From 550 million to 1 billion years ago, the two broadly agree: the record has little marine rock from the low sea level around 900 million years ago, and much more from the Ediacaran, when the calculated sea level rises. This fits the Great Unconformity, the long gap in the record beneath Cambrian rocks on many continents, and the flooding of the continents that followed it. Over the 44 maps in that time with marine rock, the correlation is 0.74. Much of it rests on 550 to 640 million years ago, which has hundreds of samples from around the world and far more marine rock than any other period; without it, the correlation is 0.52. Rock from just before the Cambrian is also better preserved and more studied, which could explain some of that excess without a higher sea. Older periods have a few dozen samples each, mostly from a few basins, such as those in the northern Rocky Mountains and near Beijing. Before 1 billion years ago, the two don’t agree, and the record is too thin to tell which is wrong. For those maps, we hold sea level constant instead of using the calculated curve.
Limits
- Plate positions before about 1 billion years ago rest on sparse paleomagnetic data. Other reconstructions place the continents differently.
- Where the rock record is thin, the shape of the land on our maps is filled in, and inland seas are drawn only where the rock record shows them.
- About 43% of today’s land lies on pieces of crust that Cao’s model doesn’t track before 550 million years ago, including much of South America. Rocks there can’t be shown on our maps.
- The maps end 1.8 billion years ago, where the plate model ends.
Sources
- Scotese, C.R. (2016). PALEOMAP PaleoAtlas for GPlates and the PaleoData Plotter Program. PALEOMAP Project. CC BY 4.0.
- Cao, X., Collins, A.S., Pisarevsky, S., Flament, N., Li, S., Hasterok, D., and Müller, R.D. (2024). Earth’s tectonic and plate boundary evolution over 1.8 billion years. Geoscience Frontiers 15, 101922. Plate model, CC BY 4.0.
- Mather, B.R., Müller, R.D., Zahirovic, S., et al. (2024). Deep time spatio-temporal data analysis using pyGPlates with PlateTectonicTools and GPlately. Geoscience Data Journal 11, 3–10. GPlately, used for the age of the ocean floor.
- Stein, C.A., and Stein, S. (1992). A model for the global variation in oceanic depth and heat flow with lithospheric age. Nature 359, 123–129.
- Stern, R.J. (2002). Subduction zones. Reviews of Geophysics 40, 1012.
- Peters, S.E., Husson, J.M., and Czaplewski, J. (2018). Macrostrat: a platform for geological data integration and deep-time Earth crust research. Geochemistry, Geophysics, Geosystems 19. Macrostrat, CC BY 4.0.
- The Paleobiology Database, CC BY 4.0.
- Lai, J., Song, H., Chu, D., Dal Corso, J., Sperling, E.A., et al. (2025). Deep-Time Marine Sedimentary Element Database (DM-SED), v4. CC BY 4.0.
- Müller, R.D., Dutkiewicz, A., Farkaš, J., Löhr, S., and Merdith, A. (2025). Mid-Proterozoic expansion of passive margins and reduction in volcanic outgassing supported marine oxygenation and eukaryogenesis. Earth and Planetary Science Letters 672, 119683. Data, CC BY 4.0.
- Worsley, T.R., Nance, D., and Moody, J.B. (1984). Global tectonics and eustasy for the past 2 billion years. Marine Geology 58, 373–400.
- Wright, N.M., Seton, M., Williams, S.E., Whittaker, J.M., and Müller, R.D. (2020). Sea-level fluctuations driven by changes in global ocean basin volume following supercontinent break-up. Earth-Science Reviews 208, 103293.
- Young, A., Flament, N., Williams, S.E., Merdith, A., Cao, X., and Müller, R.D. (2022). Long-term Phanerozoic sea level change from solid Earth processes. Earth and Planetary Science Letters 584, 117451.
- Natural Earth, for today’s coastlines and borders. Public domain.